- Nederlands, Belgique / België
- Česky, Česká republika
- Deutsch, Deutschland
- Español, España
- Português, Portugal
- English, Europe
- Français, France
- Italiano, Italia
- Magyar, Magyarország
- Nederlands, Nederland
- Deutsch, Österreich
- Polski, Polska
- Română, România
- Suisse / Schweiz / Svizzera
- Svenska, Sverige
- Suomeksi, Suomi
- Türkçe, Türkiye
- English, United Kingdom
- Slovenská, Slovak
-
 Worldwide
- All Product Highlights
- CRYSTA-KM 565
- QM-Fit
- SmartMeasure-AL
- SJ-220
- QuantuMike
- LEGEX Takumi
- STRATO-Active Series
- Measurlink 10
- TAGLENS
- MCOSMOS 5
- Crysta Apex V
- FORMTRACER Avant
- MiSTAR 555
- Calipers
- Bluetooth Data Transmission
- QuickVision Pro
- All Products by Industry
- Aerospace
- Medical
- Automotive
- Energy
- Gen. Manufacturing
- Electronics
- Original Equipment Manufacturers (OEM)
- Case Studies
- All Small Tools
- Calipers
- Micrometers & Micrometer heads
- Inside Measuring Instruments
- Depth Measuring Instruments
- Height Gauges
- Indicators & Caliper Gauges
- Auxiliary Equipment and Miscellaneous
- Calibration Instruments
- Gauge Blocks
- All CMM
- Small & Medium sized CMMs
- In-line & Shopfloor CMMs
- Large sized CMMs
- CMM Rotary Tables
- Probes
- Styli
- Fixtures
- CMM Accessories
- CMM Software
- SmartMeasure-AL
- All Vision
- Manual 2D Vision Measuring Machine QM-Fit
- Manual 2D Vision Measuring Machines Quick Image
- Manual 3D Vision Systems
- 3D CNC Vision Systems
- 3D CNC Multi-sensor Vision Systems
- 3D CNC Micro Geometry Vision Systems
- Vision System Software
- Accessories for Vision Machines
- Vision System Fixtures
- Vision System Styli
- All Optical
- Magnifiers
- Measuring Projectors
- Measuring Microscopes
- Microscope Units
- TAGLENS
- Interferometer Units
- Objective Lenses
- M2 Software for Measuring Microscopes and Projectors
- Optical Measurement Fixtures
- All Hardness
- Softwares for Hardness Testing Machines
- Portable Hardness Testers
- Hardness Reference Materials and Indenters
- Rockwell Hardness Testing Machines
- Vickers Hardness Testing Machines
- Micro-Vickers Hardness Testing Machines
- All Sensors
- Linear Gauges
- Low Force Gauges
- Counters and Display Units
- Laser Scan Micrometers
- Surface Measure
- Sensor Management Software
- Micrometers & Micrometer heads
- Digital & Mechanical Micrometers
- Micrometer Accessories
- Micrometer Heads
- Micrometer Head Accessories
- Inside Measuring Instruments
- Inside Micrometers
- Bore Gauges
- Inside Micrometer & Bore Gauge Accessories
- Indicators & Caliper Gauges
- Digital Indicators
- Indicator Accessories
- Lever Indicators
- Dial Indicators
- Dial Test Indicators Accessories
- Thickness, Caliper & Tension Gauges
- Auxiliary Equipment and Miscellaneous
- Indicator Stands
- Precision Vices
- Plates and Granite Squares
- Angle Measurement and Squares
- Feeler Gauges, Rules, Knife Edges
- Gauge Blocks
- Steel Gauge Block Sets
- Steel Individual Gauge Blocks
- Ceramic Gauge Block Sets
- Ceramic Individual Gauge Blocks
- Special Gauge Blocks
- Gauge Block Accessories
- Accessories for Square Gauge Blocks
- Small & Medium sized CMMs
- CRYSTA-Apex V PLUS - 500, 700, & 900 Series
- CRYSTA-Apex V - 1200, 1600 & 2000 Series
- CRYSTA-Apex EX Series for REVO
- STRATO-Active Series
- STRATO-Apex - 500, 700, & 900 Series
- STRATO-Apex - 1600 Series
- LEGEX Series
- CRYSTA-KM 565
- Styli
- Styli Kits
- Straight Styli
- Diamond Coated Styli
- Solid Diamond Styli
- Master Ball
- Machine Tool Styli
- Star Styli
- Styli for Star Styli
- Styli for Clamping Holder
- Cylinder Styli
- Disk Styli
- Tip Styli
- Extensions
- Holders
- Adapters
- Joints
- Screws for Cubes
- Tools
- StyliCleaner
- Fixtures
- CMM Fixturing Kits
- Eco-fix Pallet Receiver System Kits
- FixtureBuilder Software
- Eco-fix and Eco-fixplus Extension Sets
- Eco-fix and Eco-fixplus Components
- Eco-fix Screws and Tools
- 3D CNC Vision Systems
- Quick Vision ACTIVE
- Quick Vision APEX / HYPER
- Quick Vision ACCEL
- Quick Vision ULTRA
- Accessories for Vision Machines
- Objective Lenses and Calibration Charts
- QV Index
- Accessories for TP-Retrofit
- Vision System Fixtures
- Optical Measurement Fixturing Kits
- Opti-fix Components
- Opti-fix Screws and Tools
- Vision System Styli
- Straight Styli
- Extension
- Star Styli
- Holders
- Styli for 5-way Styli
- Styli for Clamping Holder
- Adapters
- Joints
- Cylinder Styli
- Disk Styli
- Tip Styli
- Screw for Cube
- Tools
- Styli Kits
- Measuring Projectors
- PJ Series
- PV Series
- PH Series
- Data Processing Unit
- Accessories
- Accuracy Inspection Tools
- Measuring Microscopes
- TM Series Gen. B
- MF Series Gen. D
- MF-U Series Gen. D
- Optional Accessories for MF and MF-U Series
- Vision Unit
- QSPAK-VUE Software
- M3 Software for MF Series
- Microscope Cameras
- Objective Lenses
- ML-Series Objectives
- Brightfield Observation Objectives
- Brightfield/Darkfield Observation Objectives
- NIR Objectives
- NIR LCD Objectives
- NUV Objectives
- NUV LCD Objectives
- UV Objectives
- UV LCD Objectives
- Interferometer Objectives
- Optical Measurement Fixtures
- Optical Measurement Fixturing Kits
- Opti-fix Components
- Opti-fix Screws and Tools
- Surface Roughness
- Surftest SJ-220
- Surftest SJ-310
- Surftest SJ-410
- Surftest SJ-500
- Surftest SV-2100
- Surftest SJ-500P
- Surftest SV-2100P
- Formtracer Avant FTA-S3000
- Surftest Extreme SV-3000CNC
- Surftest Extreme SV-M3000CNC
- Surface Roughness & Contour
- Formtracer Avant FTA-D3000 / FTA-D4000 Series
- Formtracer Avant FTA-H3000
- Formtracer Extreme SV-C4500CNC
- Formtracer Extreme SV-C4500CNC HYBRID Type 1
- Formtracer Extreme CS-5000CNC and CS-H5000CNC
- Portable Hardness Testers
- Impact Type Hardness Testing Unit HARDMATIC HH-V400
- Digital and Analogue Durometers HARDMATIC HH-300
- Hardness Reference Materials and Indenters
- Hardness reference materials
- Hardness indenters and replacement balls
- Rockwell Hardness Testing Machines
- Manual Rockwell Hardness Testing Machines
- Semi-automatic Rockwell Hardness Testing Machines
- Automatic Rockwell Hardness Testing Machines
- Vickers Hardness Testing Machines
- Manual Vickers Hardness Testing Machines
- Semi-automatic Vickers Hardness Testing Machines
- Automatic Vickers Hardness Testing Machines
- Micro-Vickers Hardness Testing Machines
- Manual Micro-Vickers Hardness Testing Machines
- Semi-automatic Micro-Vickers Hardness Testing Machines
- Automatic Micro-Vickers Hardness Testing Machines
- Linear Gauges
- ABSOLUTE Digimatic Linear Gauge LGS Series
- Air Drive Unit
- Linear Gauge LG100 Series
- Linear Gauge LG200 Series
- Laser Hologauge
- Counters and Display Units
- EJ Counter and Interfaces for Linear Gauges
- EC Counter for Linear Gauges
- EG Counter for Linear Gauges
- EH Counter for Linear Gauges
- EV Counter for Linear Gauges
- Display Unit for EV Counter
- Laser Scan Micrometers
- Laser Scan Micrometer Measuring Unit
- Laser Scan Micrometer Controller Unit
- Laser Scan Micrometer Interface Unit
- Laser Scan Micrometer Optional Accessories
- DRO Linear Scales and Counters
- DRO Linear Scales AT103
- DRO Linear Scales AT103 - High Accuracy
- DRO Linear Scales AT113
- DRO Linear Scales AT113 - High Accuracy
- DRO ABS Linear Scales AT715
- Universal DRO KA-200 Counter
- NC Linear Scales
- NC Linear Scales ST36
- NC Linear Scales ST46-EZA
- NC Linear Scales ABS ST700
- NC Linear Scales ABS ST1300
- NC Linear Scales AT211
- NC Linear Scales ABS AT1100
- NC Linear Scales ABS AT1300
- Scale Units
- Horizontal ABSOLUTE Scale Coolant Proof IP66
- Horizontal ABSOLUTE Scale Standard
- Horizontal ABSOLUTE Scale Measurement Direction Switching
- Horizontal ABSOLUTE Scale Diameter Function
- Vertical ABSOLUTE Scale Standard
- Vertical ABSOLUTE Scale Measurement Direction Switching
- Vertical ABSOLUTE Scale Diameter Function
- Signal Cables
- USB Input Tool Direct (Digimatic-USB Cable)
- Digimatic Data Cables
- Digimatic Extension Cables
- Wireless Communication
- Wireless Communication System U-WAVE
- U-WAVE Bluetooth
- U-WAVE-T Connection Cables and Connection Units
- Interfaces
- USB Input Tool
- DMT-3T / FS2 USB
- DMX-1
- DMX-1 USB
- DMX-2 S
- DMX-2 USB
- DMX-3 USB
- MUX-10F
- DMX-8/2
- DMX-16 / DMX-16C
- DMX-0-1 USB / DMX-3-2 USB
 Aerospace
Complex aerospace applications need fast, extremely precise quality control to ensure accurate assemblies. See how Mitutoyo makes it happen
 Automotive
The automotive industry continues to innovate, and Mitutoyo delivers the advanced inspection and scanning capabilities to help manufacturers achieve ongoing production
 Energy
Mitutoyo’s measurement and analysis solutions are designed to help energy providers improve reliability and increase equipment uptime.
 Medical
To protect patient well-being, medical applications require exceptional accuracy. See how extensively tested solutions from Mitutoyo can help you achieve it.
 Gen. Manufacturing
Ensure high repeatability and rigorous quality control with form measurement solutions, coordinate measuring machines and precision measuring tools from Mitutoyo.
 Electronics
The non-contact and vision measurement solutions from Mitutoyo bring microscopic accuracy to smaller and denser electronic components
 Original Equipment Manufacturers (OEM)
Mitutoyo OEM can address missing expertise or resources by supplying you with our renowned Metrology equipment that seamlessly integrates into your products.
 Case Studies
For an overview of Mitutoyo's capabilities, this is no greater place to look than our marvelous collection of case studies.
 Mitutoyo Japan Desk
The first stop for Japanese companies operating in Europe

 Custom Products
Custom-made products for unique applications
 Manufacturing Automation Integration
Turn your factory into a smart factory with the help of Mitutoyo
 Mitutoyo Integrators
Integrating your measuring devices into existing processes made easy
 Repairs & Spare Parts
Spare parts and repairs for Mitutoyo devices
 Field Services
On-site service of your favorite measurement and testing machines
 Measurement Services
Get your workpieces and parts measured from anywhere in Europe
 Metrology and Product Training
The quickest way to get support or training
 Product Demos
Online or offline, get a product demonstration today
 IT Support
Perfect and hassle-free installation and integration into your IT infrastructure.
 Education Pack
Perfect for the workshop or classroom, there is no greater help than posters or learning material from Mitutoyo
 E-Learning
For those interested in metrology, Mitutoyo offers E-Learning courses to help train students, staff, or even hobbyists
 Online Material
If you're looking for a quick way to learn more about measurement, check out our many instructional videos.
 Webinars
Explore our free webinars on measurement technology, best practices, and industry trends
 Discover Mitutoyo
Unmatched expertise in measurement
 Mitutoyo Partners
Find out here who our Dealer Partners in Europe are
 Certifications & Legitimacy
Here you can explore our certifications, accreditations and legitimacy to ensure trusted and verified services
 Career
Learn more about how it feels to work at Mitutoyo and the next steps toward starting your career here
 Merchandising
The popular destination for high-quality Mitutoyo apparel and more!
 Sustainability Overview
Find out more about Mitutoyo's contribution towards Sustainability


 Leaflets
Discover our product brochures and download them
 Declarations of Conformity
Here you can download the full versions for the EU and the UK
 Free Wallpapers
Download official Mitutoyo wallpapers here for free
 Mitutoyo Brand Communication Materials
Resources for Mitutoyo staff and external suppliers
 Online Catalog
View our extensive product range in our online catalog!
-
Products
- Back Products
- Products
- Product Highlights
- Products by Industry
-
Small Tools
- Back Small Tools All Small Tools
- Calipers
-
Micrometers & Micrometer heads
- Back Micrometers & Micrometer heads Micrometers & Micrometer heads
- Digital & Mechanical Micrometers
- Micrometer Accessories
- Micrometer Heads
- Micrometer Head Accessories
-
Inside Measuring Instruments
- Back Inside Measuring Instruments Inside Measuring Instruments
- Inside Micrometers
- Bore Gauges
- Inside Micrometer & Bore Gauge Accessories
-
Depth Measuring Instruments
- Back Depth Measuring Instruments Depth Measuring Instruments
- Depth Micrometers
- Depth Calipers & Gauges
- Depth Caliper Accessories
- Height Gauges
- Indicators & Caliper Gauges
-
Auxiliary Equipment and Miscellaneous
- Back Auxiliary Equipment and Miscellaneous Auxiliary Equipment and Miscellaneous
- Indicator Stands
- Precision Vices
- Plates and Granite Squares
- Angle Measurement and Squares
- Feeler Gauges, Rules, Knife Edges
-
Calibration Instruments
- Back Calibration Instruments Calibration Instruments
- Height Masters
- Check Masters
- Calibration Tools
- Gauge Blocks
-
CMM
- Back CMM All CMM
- Small & Medium sized CMMs
-
In-line & Shopfloor CMMs
- Back In-line & Shopfloor CMMs In-line & Shopfloor CMMs
- MACH Ko-ga-me
- MACH 3A 653
- MACH V 9106
- MiSTAR
-
Large sized CMMs
- Back Large sized CMMs Large sized CMMs
- STRATO Apex G
- CARB-Series
-
CMM Rotary Tables
- Back CMM Rotary Tables CMM Rotary Tables
- MRT240 Rotary Table
- MRT320 Rotary Table
- Probes
- Styli
- Fixtures
-
CMM Accessories
- Back CMM Accessories CMM Accessories
- Enclosures
- Security System
-
CMM Software
- Back CMM Software CMM Software
- MiCAT Planner
- MCOSMOS
- MAFIS Express
- MSURF
- GEARPAK EXPRESS
- SmartMeasure-AL
-
Vision
- Back Vision All Vision
- Manual 2D Vision Measuring Machine QM-Fit
-
Manual 2D Vision Measuring Machines Quick Image
- Back Manual 2D Vision Measuring Machines Quick Image Manual 2D Vision Measuring Machines Quick Image
- Quick Image
- Quick Image Software
-
Manual 3D Vision Systems
- Back Manual 3D Vision Systems Manual 3D Vision Systems
- Manual Quick Scope
- Quick Scope Software
-
3D CNC Vision Systems
- Back 3D CNC Vision Systems 3D CNC Vision Systems
- Quick Vision ACTIVE
- Quick Vision APEX / HYPER
- Quick Vision ACCEL
- Quick Vision ULTRA
-
3D CNC Multi-sensor Vision Systems
- Back 3D CNC Multi-sensor Vision Systems 3D CNC Multi-sensor Vision Systems
- Quick Vision Hybrid
- Quick Vision WLI
-
3D CNC Micro Geometry Vision Systems
- Back 3D CNC Micro Geometry Vision Systems 3D CNC Micro Geometry Vision Systems
- UMAP Vision Systems
- UMAP Software
-
Vision System Software
- Back Vision System Software Vision System Software
- QVPAK
- QSPAK
- QIPAK
-
Accessories for Vision Machines
- Back Accessories for Vision Machines Accessories for Vision Machines
- Objective Lenses and Calibration Charts
- QV Index
- Accessories for TP-Retrofit
-
Vision System Fixtures
- Back Vision System Fixtures Vision System Fixtures
- Optical Measurement Fixturing Kits
- Opti-fix Components
- Opti-fix Screws and Tools
- Vision System Styli
-
Optical
- Back Optical All Optical
-
Magnifiers
- Back Magnifiers Magnifiers
- Clear Loupes
-
Measuring Projectors
- Back Measuring Projectors Measuring Projectors
- PJ Series
- PV Series
- PH Series
- Data Processing Unit
- Accessories
- Accuracy Inspection Tools
- Measuring Microscopes
-
Microscope Units
- Back Microscope Units Microscope Units
- Microscope Unit FS70 Series
- Video Microscope Unit VMU Series
- TAGLENS
- Interferometer Units
- Objective Lenses
- M2 Software for Measuring Microscopes and Projectors
-
Optical Measurement Fixtures
- Back Optical Measurement Fixtures Optical Measurement Fixtures
- Optical Measurement Fixturing Kits
- Opti-fix Components
- Opti-fix Screws and Tools
-
Form
- Back Form All Form
- Surface Roughness
- Contour
- Surface Roughness & Contour
-
Form
- Back Form Form
- Roundtest
- Roundtracer
-
FMI Software
- Back FMI Software FMI Software
- Formtracepak
- Roundpak
- MCube Map V9
-
Fixtures
- Back Fixtures Fixtures
- Eco-fix FMI Kits
- PinFlex System
-
Hardness
- Back Hardness All Hardness
-
Softwares for Hardness Testing Machines
- Back Softwares for Hardness Testing Machines Softwares for Hardness Testing Machines
- AVPAK
- Portable Hardness Testers
-
Hardness Reference Materials and Indenters
- Back Hardness Reference Materials and Indenters Hardness Reference Materials and Indenters
- Hardness reference materials
- Hardness indenters and replacement balls
- Rockwell Hardness Testing Machines
- Vickers Hardness Testing Machines
- Micro-Vickers Hardness Testing Machines
- Sensors
-
Digital Scales
- Back Digital Scales All Digital Scales
- DRO Linear Scales and Counters
- NC Linear Scales
-
Scale Units
- Back Scale Units Scale Units
- Horizontal ABSOLUTE Scale Coolant Proof IP66
- Horizontal ABSOLUTE Scale Standard
- Horizontal ABSOLUTE Scale Measurement Direction Switching
- Horizontal ABSOLUTE Scale Diameter Function
- Vertical ABSOLUTE Scale Standard
- Vertical ABSOLUTE Scale Measurement Direction Switching
- Vertical ABSOLUTE Scale Diameter Function
-
Rotary Encoders
- Back Rotary Encoders Rotary Encoders
- ABS OR700 BiSS-C
- ABS OR700 FANUC
- ABS OR700 ENSIS
-
Data Management
- Back Data Management All Data Management
-
Data Management Software
- Back Data Management Software Data Management Software
- MeasurLink 10
- USB-ITPAK
-
Mini Processors
- Back Mini Processors Mini Processors
- Digimatic Mini Processor DP-1VA LOGGER
- Signal Cables
- Wireless Communication
- Interfaces
-
Timerbox, Digimatic Switch Box
- Back Timerbox, Digimatic Switch Box Timerbox, Digimatic Switch Box
- Digimatic Timerbox
- Digimatic Switch Box
-
Software
- Back Software All Software
-
CMM Software
- Back CMM Software CMM Software
- MiCAT Planner
- MCOSMOS
- MAFIS-Express
- MSURF
- GEARPAK EXPRESS
-
Vision System Software
- Back Vision System Software Vision System Software
- QVPAK
- QSPAK
- QIPAK
- M3 Software for Quick Image
-
Optical System Software
- Back Optical System Software Optical System Software
- M2 Software for Microscopes and Projectors
- M3 Software for MF Microscopes
- QSPAK-VUE
-
FMI Software
- Back FMI Software FMI Software
- Formtracepak
- Roundpak
- MCube Map V9
- Hardness Testing Software
- Sensor Management Software
-
Data Management Software
- Back Data Management Software Data Management Software
- Measurlink 10
- USB-ITPAK
- Automated Measuring Devices
- Computed Tomography Systems
- Industries
-
Services
- Back Services
- Services
- Mitutoyo Japan Desk
-
Smart Factory Solutions
- Back Smart Factory Solutions
- Smart Factory Solutions
- Custom Products
- Manufacturing Automation Integration
- Mitutoyo Integrators
- Repairs & Spare Parts
-
Calibration
- Back Calibration
- Calibration
- Field Services
- Measurement Services
- Metrology and Product Training
- Product Demos
- IT Support
-
Education
- Back Education
- Education
- Education Pack
- E-Learning
- Online Material
- Webinars
-
About us
- Back About us
- About us
-
Discover Mitutoyo
- Back Discover Mitutoyo
- Discover Mitutoyo
-
Mitutoyo History
- Back Mitutoyo History
- Mitutoyo History
- Name & Philosophy
- Mitutoyo Corporation
- Mitutoyo in Europe
- Brand
-
Mitutoyo Partners
- Back Mitutoyo Partners
- Mitutoyo Partners
- Mitutoyo Spain
- Mitutoyo Portugal
- Mitutoyo Turkey
-
Certifications & Legitimacy
- Back Certifications & Legitimacy
- Certifications & Legitimacy
- Certifications & Accreditations
- Products Legitimacy (FAKE)
-
Career
- Back Career
- Career
- Mitutoyo Trainee Program
- Merchandising
- Sustainability Overview
-
News
- Back News
- News
- Events
-
Special Promotions
- Back Special Promotions
- Special Promotions
- Press Area
- Downloads


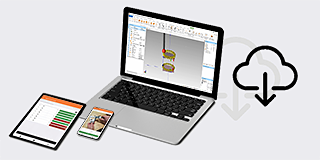
Make sure your headquarters can be continuously connected and increase measurement efficiency, by linking design and measurement. The real-time linking of production floor measurement data connects production and measurement to bring greater visibility to quality. Measurement IoT will change your company.

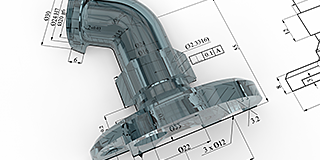
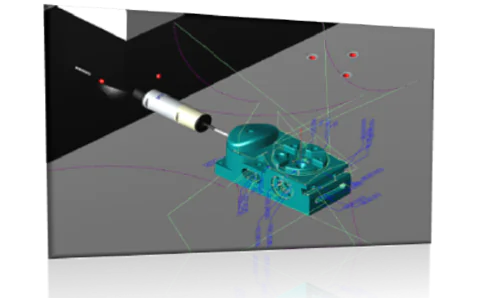
LINKING DESIGN AND MEASUREMENT
To increase the efficiency of measurement operations, take a close look at the design process. Just adding tolerance information to 3D CAD models makes the "one-click"
generation of measurement models by "MiCAT Planner" possible. Save up to 95 percent time with our ground-breaking CMM measurement program generation software.

Measurement Program Preparation Time Cut by Up to 95%
What took 45 to 60 minutes with a traditional "2D diagram" manual method and 15 to 20 minutes with a "2D diagram + 3D CAD" method, can now be completed in approximately 3 minutes using MiCAT Planner.
Sample block measurement part program preparation time comparison
Automatically optimized measurement path
Measurement in the Quickest Time Possible; a Dramatic Increase in Measurement Operation Efficiency
What took 45 to 60 minutes with a traditional "2D diagram" method manually and 15 to 20 minutes with a "2D diagram + 3D CAD file" method, can now be completed in approximately 3 minutes using MiCAT Planner.
Using optimization functions, the smallest number of probe-position and tool changes and the shortest measurement path is determined by the software, and a program is generated for the measurement in the minimum amount of time.
By shortening measurement time, large measurement operation efficiency gains are possible!
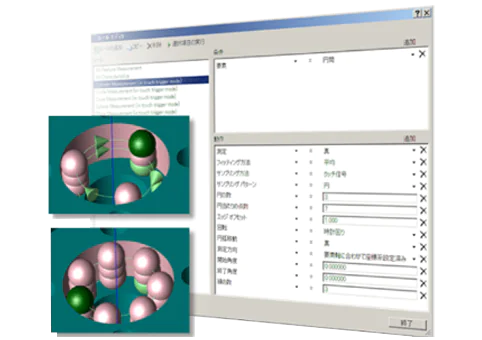
Stable Measurement Quality With No Variations Between Workers
By defining measurement rules using the rules editor function, you can automatically generate a measurement path conforming to those rules. This prevents quality variations between programmers.
Also, you can automatically generate a measurement path conforming to those rules, so there are no variations between programmers.
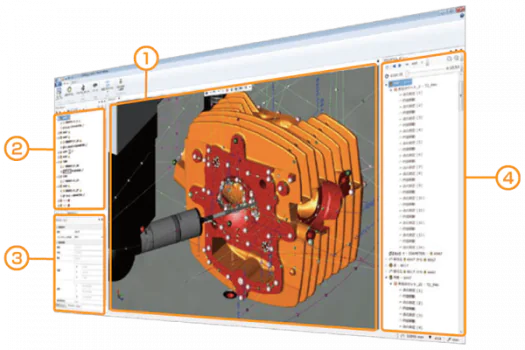
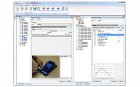
Screen configuration and functions
Intuitive operations; easy-to-use simple view
The MiCAT Planner screen configuration provides a "simple view" configuration that enables intuitive operations (3D view, plan view, etc.). You can also freely customize positioning and window size.
| ① 3D view | Graphical information is displayed. ・Measuring device information ・CAD models, tolerance information ・Measuring points, measurement path ・Measuring animation |
| ② Plan view | ・Display list of measuring elements, tolerances, etc. ・The existence of measurement and evaluation can be selected using a check box. |
| ③ Property view | Element, tolerance, and measuring point name changes and measuring point editing can be done for each individual element. |
| ④ Program view | ・Display measurement details and projected measurement times. ・Using the animation function, it is possible to execute a 3D-view measurement animation. |
| CAD formats | Extension | Supported versions |
|---|---|---|
| ACIS | .sat | R1-2016.1.0 (PMI not supported) |
| STEP | .step/ .stp | AP203, AP204, AP242 (PMI not supported) |
| NX *1 | .prt | 11-18, NX1-10 |
| Creo Parametric (Pro/E) *1 | .prt/ .prt.* | 16-Wildfire5, Creo 1.0-3.0 |
| CATIA v5 *1 | .CATPART | v5 R8 – 5 – 6R2016 |
| Solid Works *1 | .sldprt | 98 - 2016 (with PMI: 2014 - 2016) |
*1 Option (One of the types is included as standard.)
Note: The model needs to be a solid model. Assembly data not supported.

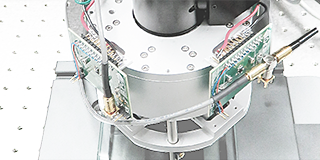
LINKING PRODUCTION AND MANAGEMENT
Using production floor data, build SPC (statistical process control) so that only good-quality products are produced. The "MeasurLink" measurement data network system gathers data from various types of measuring equipment and generates real-time displays of the results of statistical processing (control charts, histograms, process capability indexes, etc.).
The result is SPC.
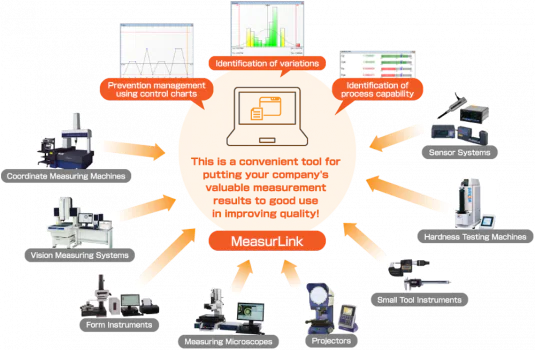
Prevent scrap; produce only good-quality products
Gather real-time data from all network-connected measuring devices and then forecast defect occurrence using statistical process control.
Put your company's valuable measurement results to good use in improving quality. The quality of tomorrow's products can be known today.
Diverse and Easy-To-Use Data Collection Screens
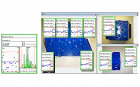
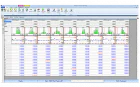
Extensive Statistical Analysis Function Support (Xbar-R Control Charts, Run Charts, etc.)
Using the diverse range of statistical analysis and display functions, you can obtain results applicable to your particular situation and objectives


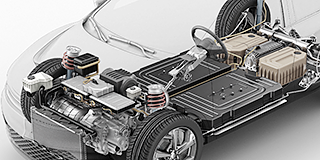
Alarm Function Warns Operators of Abnormalities
A warning is sent to the operator when abnormalities (Out of Tolerance, Out of Control Limit) occur. The warning method can be selected as a pop-up window display, email notification, log file entry, etc.

LINKING MANAGEMENT AND MEASUREMENT
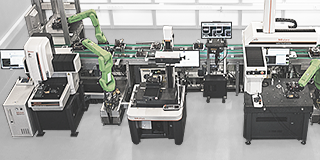
In-line measurement enables 100% inspection and centralized management. The resulting earlier discovery of defective products enables faster countermeasures and rework cost reductions, with the end result being an increase in profit.
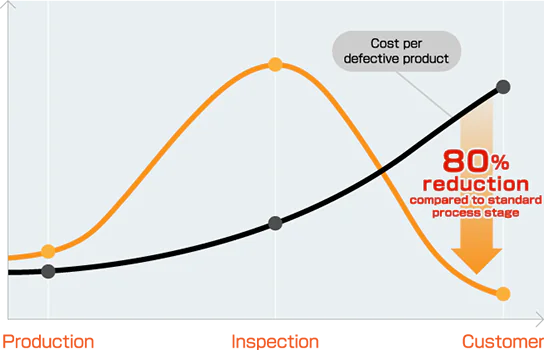
Early Discovery of Defective Products
The MACH-3A makes it possible to discover defective products at an early stage in the production process.
Installation of the "MACH-3A" 3D measuring device makes it possible to discover defective products at an early stage in the production process. Through the early discovery of defective products, you can hold down the costs that such products generate.
Raise to 80% the percentage for "defective product discovery" in the production process stage.

MeasurLink, MiCAT Planner, and Smart Factories
It is clear that manufacturing industry process control is extremely important, not only for the production floor but also for corporate management.
In a Smart Factory, all equipment in the factory is connected to the Internet, and a diverse range of information is collected, analyzed, and managed so it can be put to good use on the production floor and in corporate management.
Through the installation of MeasurLink and MiCAT Planner, you can take a step forward in the realization of a Smart Factory.

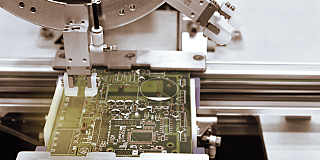
LINKING THE WORLD AND MEASUREMENT
Headquarters in the home country can be continuously connected via a network to factories dotting the globe. As market globalization progresses, connections between sites are expanding to a worldwide scale in the manufacturing industry. This is truly an era in which quality must be sustained at factories throughout the world.
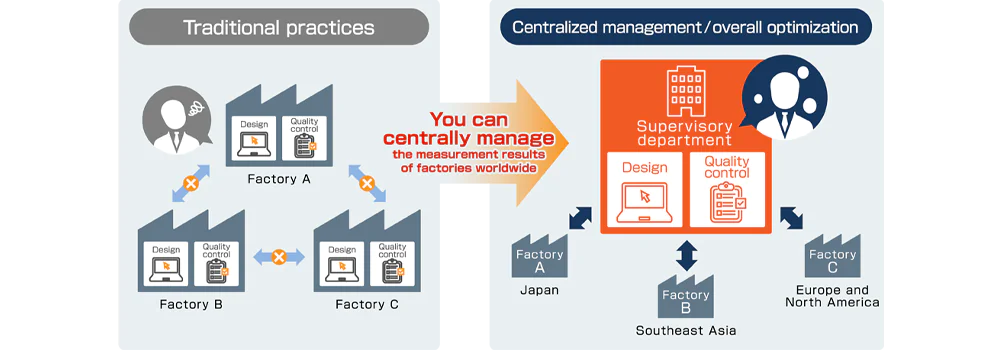
Global Control of Quality Assurance Data
An increasing number of companies have factories overseas, primarily in Asia, and this includes not only huge enterprises but also medium- and small-sized firms. So it is important to produce products at a high-quality level at factories across the globe. By installing MeasurLink, you can perform centralized management of the measurement results of factories everywhere and achieve quality increases globally.